This report is designed to transform a raw inventory of IT assets into a strategic, boardroom-ready analysis. It bridges the gap between technical data and business outcomes, allowing IT leaders, executives, and finance teams to make informed decisions about hardware lifecycle management, cost optimization, security posture, and environmental, social, and governance (ESG) goals.
This report is designed to transform a raw inventory of IT assets into a strategic, boardroom-ready analysis. It bridges the gap between technical data and business outcomes, allowing IT leaders, executives, and finance teams to make informed decisions about hardware lifecycle management, cost optimization, security posture, and environmental, social, and governance (ESG) goals.
How to use this report
-
For Executive Overviews: Start and end with the Executive Analysis. It contains the most critical business-impact metrics needed for high-level decision-making.
-
For Identifying Savings: Use the Sustainability & Green IT Optimization section to find immediate, actionable opportunities to reduce operational expenditure (OpEx) and defer capital expenditure (CapEx).
-
For Technical Planning: The CPU Ecosystem & Performance section provides the data needed to plan for major initiatives like the Windows 11 migration and to identify the root cause of performance issues.
-
For Granular Analysis: The Detailed Hardware Appendix is your source of truth for answering specific questions about asset counts, models, and their lifecycle status.
1. Executive Analysis
What it is
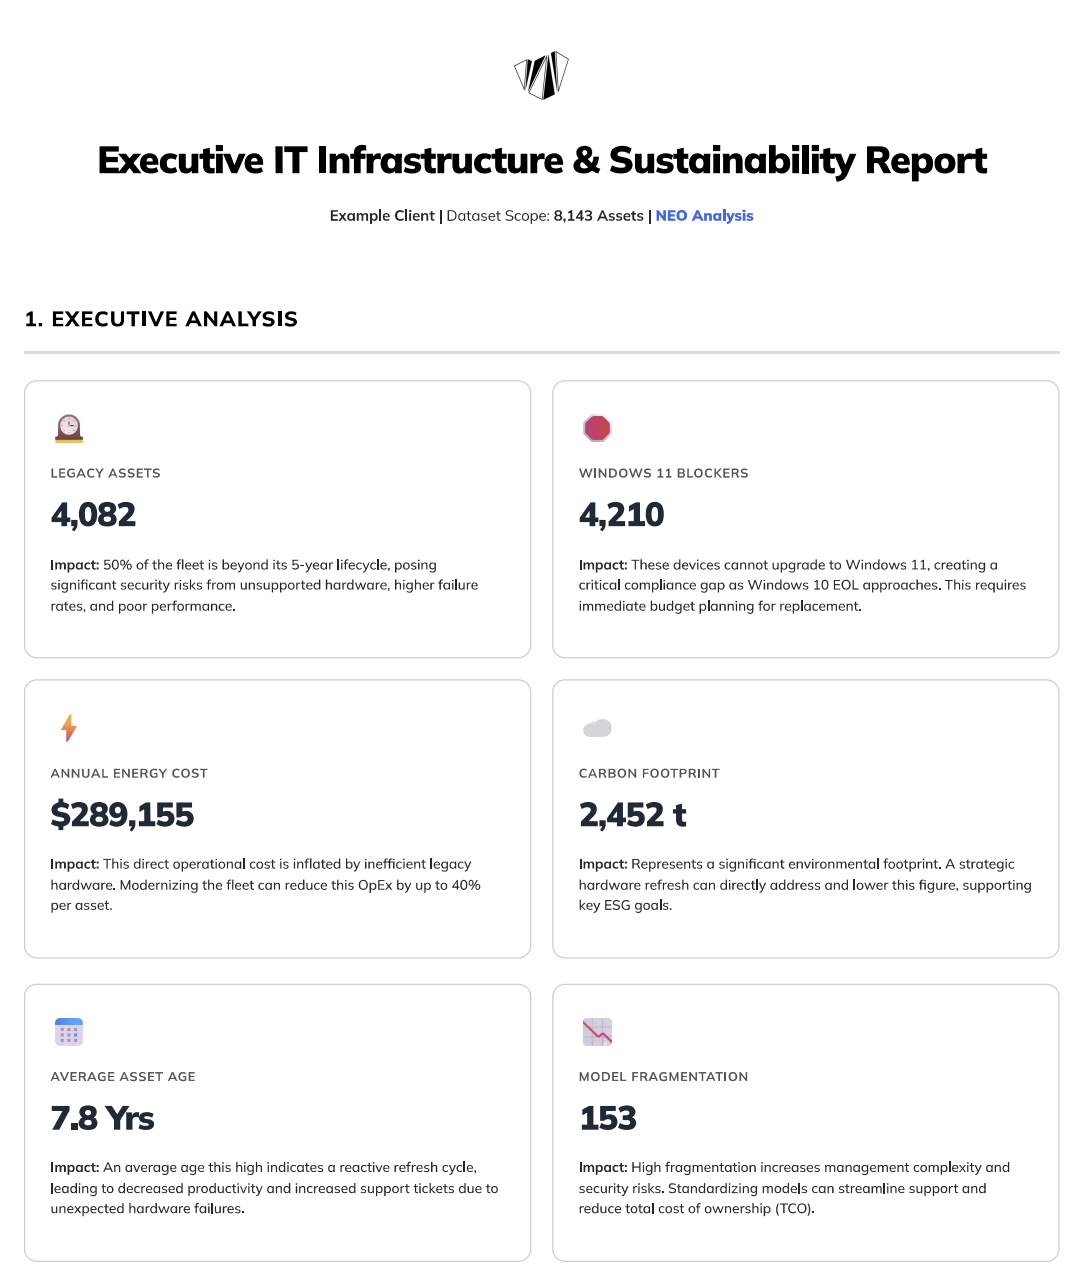
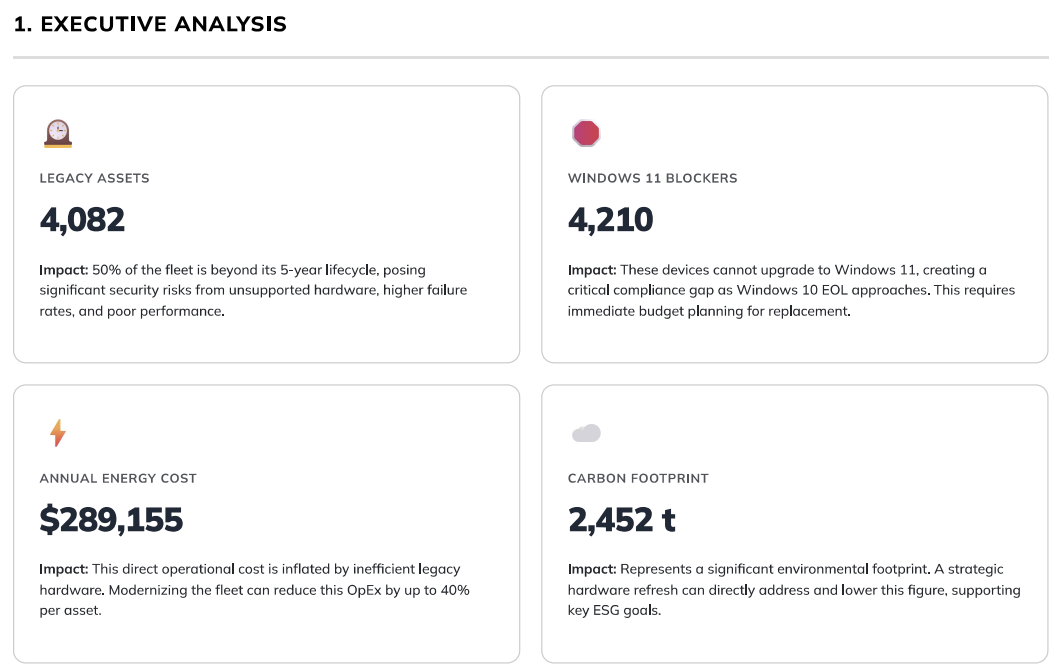
This is the high-level summary of the entire report, presented as a series of Key Performance Indicators (KPIs) in "cards." Each card displays a critical number and a concise explanation of its business impact.
Why it matters
This section is designed to be understood in under 60 seconds. It immediately highlights the most significant risks and opportunities within your IT hardware fleet, framing technical data in terms of cost, risk, and security.
How to use it
-
Legacy Assets & Average Asset Age: Use these two metrics to build a business case for a hardware refresh program. A high number of legacy assets directly correlates with increased support tickets, lost productivity, and higher security risks from unpatchable firmware.
-
Windows 11 Blockers: This is a time-sensitive risk. Use this number to communicate the urgency and scale of the required replacements to stakeholders before the Windows 10 end-of-life date. This is a key input for budget planning.
-
Annual Energy Cost & Carbon Footprint: Share these figures with your finance and ESG committees. The energy cost represents a tangible OpEx that can be reduced, while the carbon footprint is a key metric for corporate sustainability reporting.
-
Model Fragmentation: Use this to advocate for hardware standardization. A high number of unique models increases the total cost of ownership (TCO) through complex support, varied security patching, and inefficient procurement.
2. Sustainability & Green IT Optimization
What it is
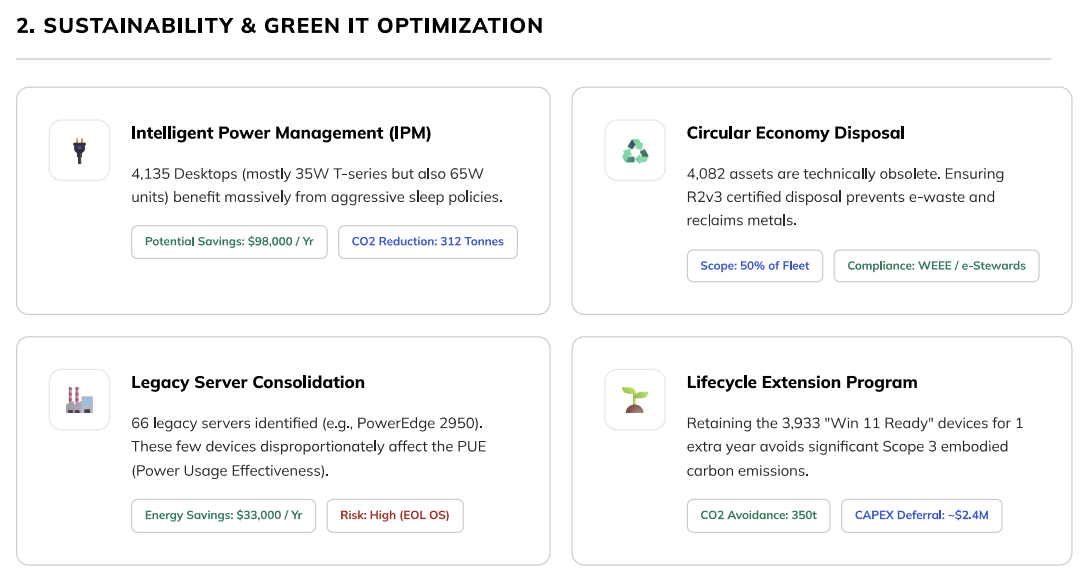
This section moves from identifying problems to presenting concrete solutions. Each card outlines a specific, actionable program that can be implemented to reduce costs and improve your environmental footprint.
Why it matters
This is your roadmap for "quick wins." These optimizations often have a clear and measurable Return on Investment (ROI), making them easy to justify. It demonstrates how the IT department can be a proactive partner in achieving broader business goals like cost reduction and sustainability.
How to use it
-
Intelligent Power Management: This is often the easiest and fastest initiative to implement. Task your endpoint management team to create and enforce power-saving policies. The potential savings figure can be used to track the success of the program.
-
Circular Economy Disposal: Use the list of obsolete assets from the Detailed Appendix to engage with certified IT Asset Disposition (ITAD) and e-waste partners. This ensures compliance with regulations like WEEE and protects the company's brand.
-
Legacy Server Consolidation: This presents a dual opportunity: significant energy savings and a reduction in security risk from running end-of-life operating systems. Initiate a project to migrate workloads from these devices to modern on-premise or cloud infrastructure.
-
Lifecycle Extension Program: Use the count of "Win 11 Ready" devices to justify delaying their replacement. This provides a powerful lever for deferring CapEx, allowing you to focus budget on replacing the most critical, incompatible devices first.
3. CPU Ecosystem & Performance
What it is
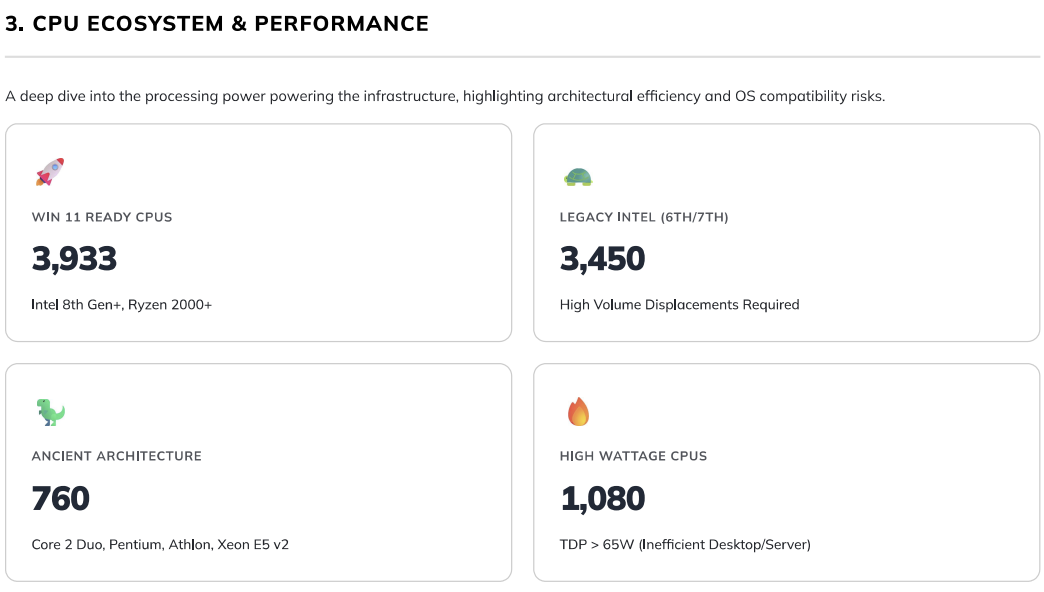
A more technical deep-dive into the processors (CPUs) that power your device fleet. It breaks down the estate by performance, efficiency, and OS compatibility.
Why it matters
This section provides the root-cause analysis for the issues highlighted in the Executive Summary. It shows why devices are incompatible with Windows 11 and identifies the most inefficient assets that are driving up energy costs and frustrating users.
How to use it
-
Top Processors by Volume Table: This table is your tactical hit-list. Identify the top 2-3 incompatible CPU models (e.g., Intel Core i5-6500). The "Count" column tells you how many devices you can remediate by targeting just that one model, making refresh planning highly efficient.
-
Architecture Rightsizing Card: The devices listed here (running on Pentium or Core 2 Duo chips) offer the single biggest "bang for the buck" improvement. Replacing one of these can yield a 10x improvement in performance-per-watt, resulting in a happier user and lower energy bills.
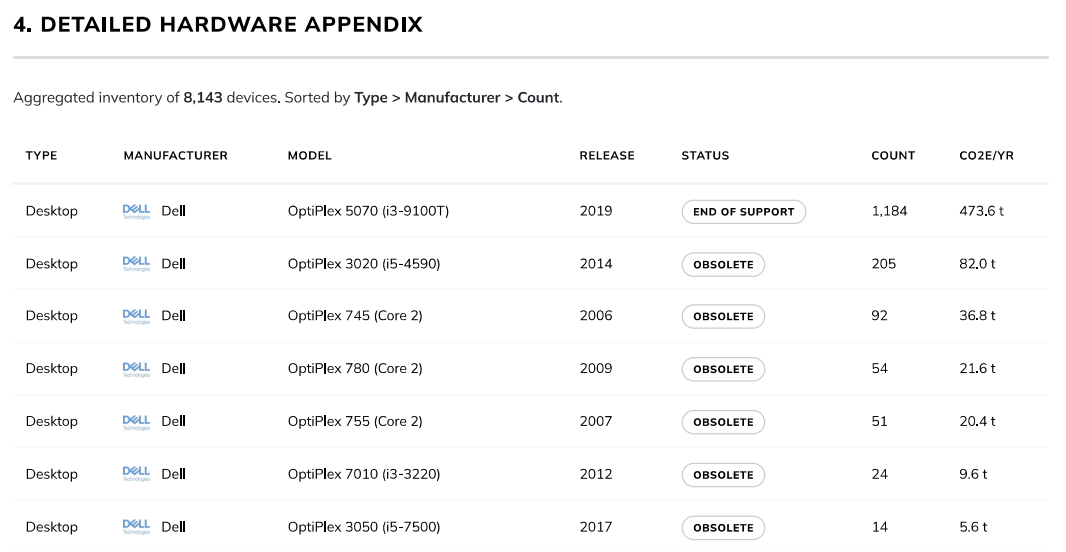
4. Detailed Hardware Appendix
What it is
This is the complete, aggregated inventory of all 8,143 assets, sorted by type, manufacturer, and model count. It acts as the foundational dataset for the entire report.
Why it matters
This table provides complete transparency and allows for detailed, granular analysis. It is the "single source of truth" that all the summary cards are built upon, enabling you to drill down into the specifics of any metric.
How to use it
-
Answer Specific Questions: Quickly find out "How many HP EliteBook 840 G3s do we have?" or "What is the total carbon footprint of our Dell OptiPlex desktops?"
-
Create Targeted Action Lists: Filter the table by "Status: Obsolete" to generate a complete list of devices that need to be prioritized for replacement or disposal.
-
Inform Procurement: Use the model counts to understand your current standards and identify opportunities to consolidate vendors or models for better volume pricing.
Appendix B: Methodology & Audit Trail
What it is
This section explains the rules, formulas, and industry-standard models (PAIA and TEWI) used to calculate the financial, environmental, and compliance data in the report.
Why it matters
Trust and auditability. When presenting this report to leadership, finance, or auditors, you will inevitably be asked, "Where did these numbers come from?" This section provides the answer. It shows that the analysis is based on consistent, defensible logic, not guesswork.
How to use it
-
Refer to this section to confidently answer any questions about the data's validity.
-
Use the stated assumptions (e.g., "$0.15 / kWh") to adjust calculations if your organization has more precise internal figures, further increasing the report's accuracy.