
Using reports
Licenseware automatically generates a series of standard reports after your data is processed. They are under Reports.
Accessing reports
Section titled “Accessing reports”Open Reports from the sidebar. You’ll find three tabs:
- Reports: reports generated automatically from your uploaded or connected data.
- NEO Reports: AI-written insight reports. See NEO Reports.
- Custom: where you can design your own dashboards.
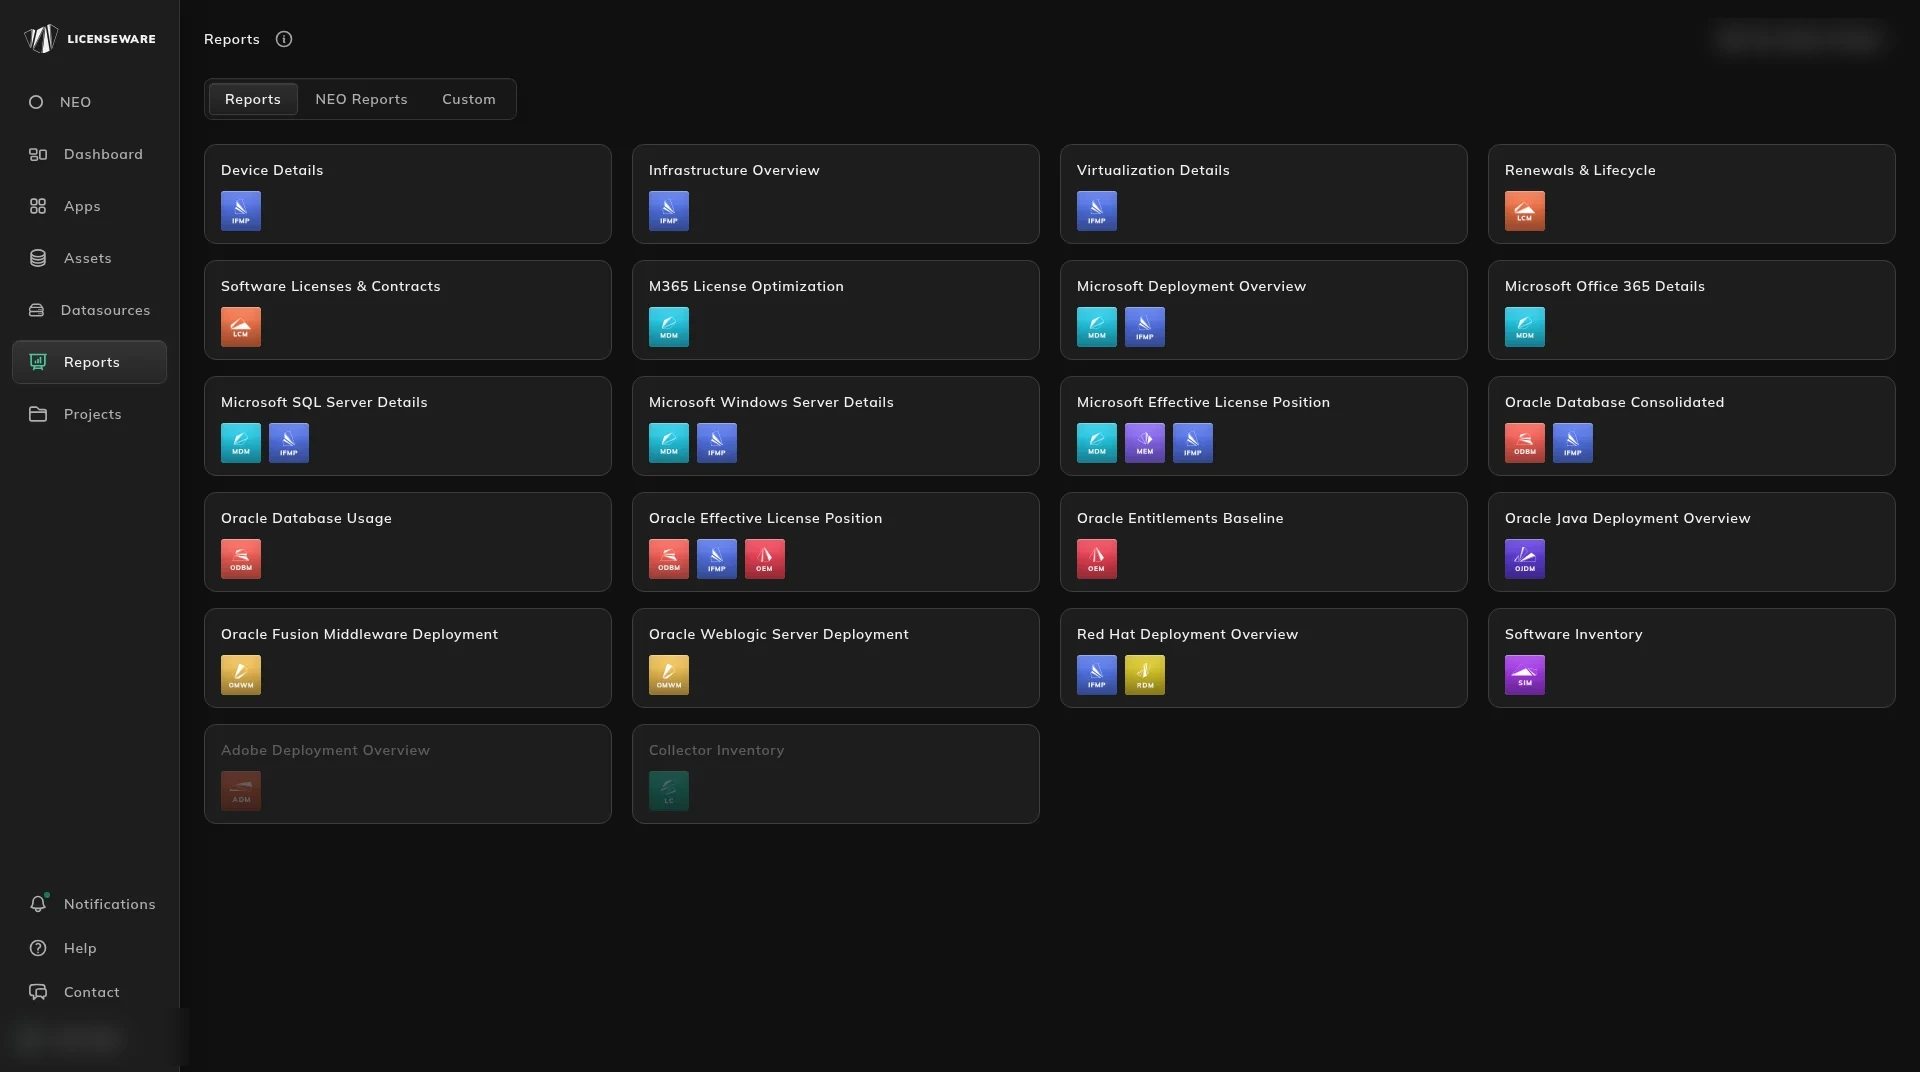
Each card shows the report’s name and a badge for every app whose data it uses. Cards that appear greyed out, such as Adobe Deployment Overview here, don’t have the data they need yet. The ⋮ menu on that card reads Missing data - click apps to upload and shows the icon of the app that needs data, such as ADM.
What you can do in the Reports view
Section titled “What you can do in the Reports view”- Open a report: click its card to view its contents.
- See more about a report: hover the card and open the ⋮ menu, or click the (i). That opens the info panel.
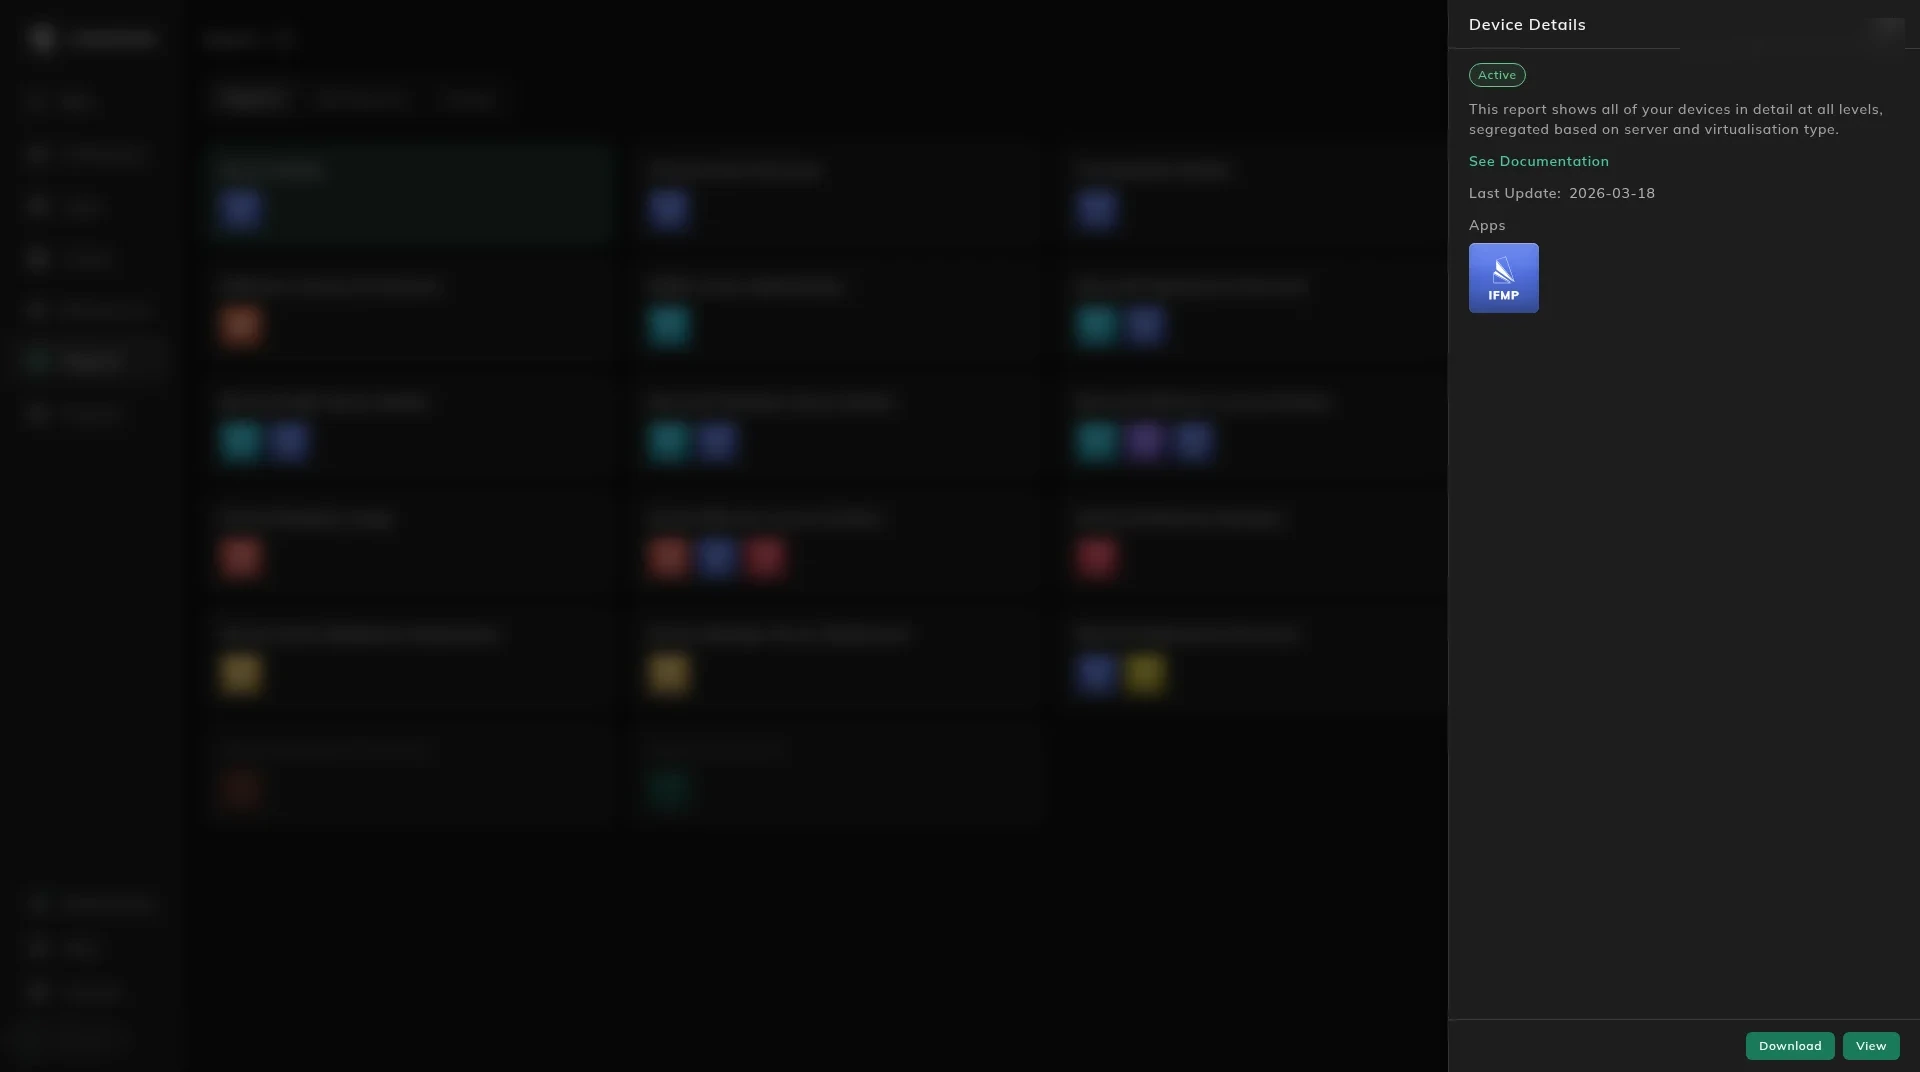
The panel shows:
- The report’s status, for example Active.
- A description of what the report covers.
- See Documentation, a link to the report’s own guide.
- Last Update: when the report was last refreshed.
- The icon of each app whose data the report needs, for example IFMP.
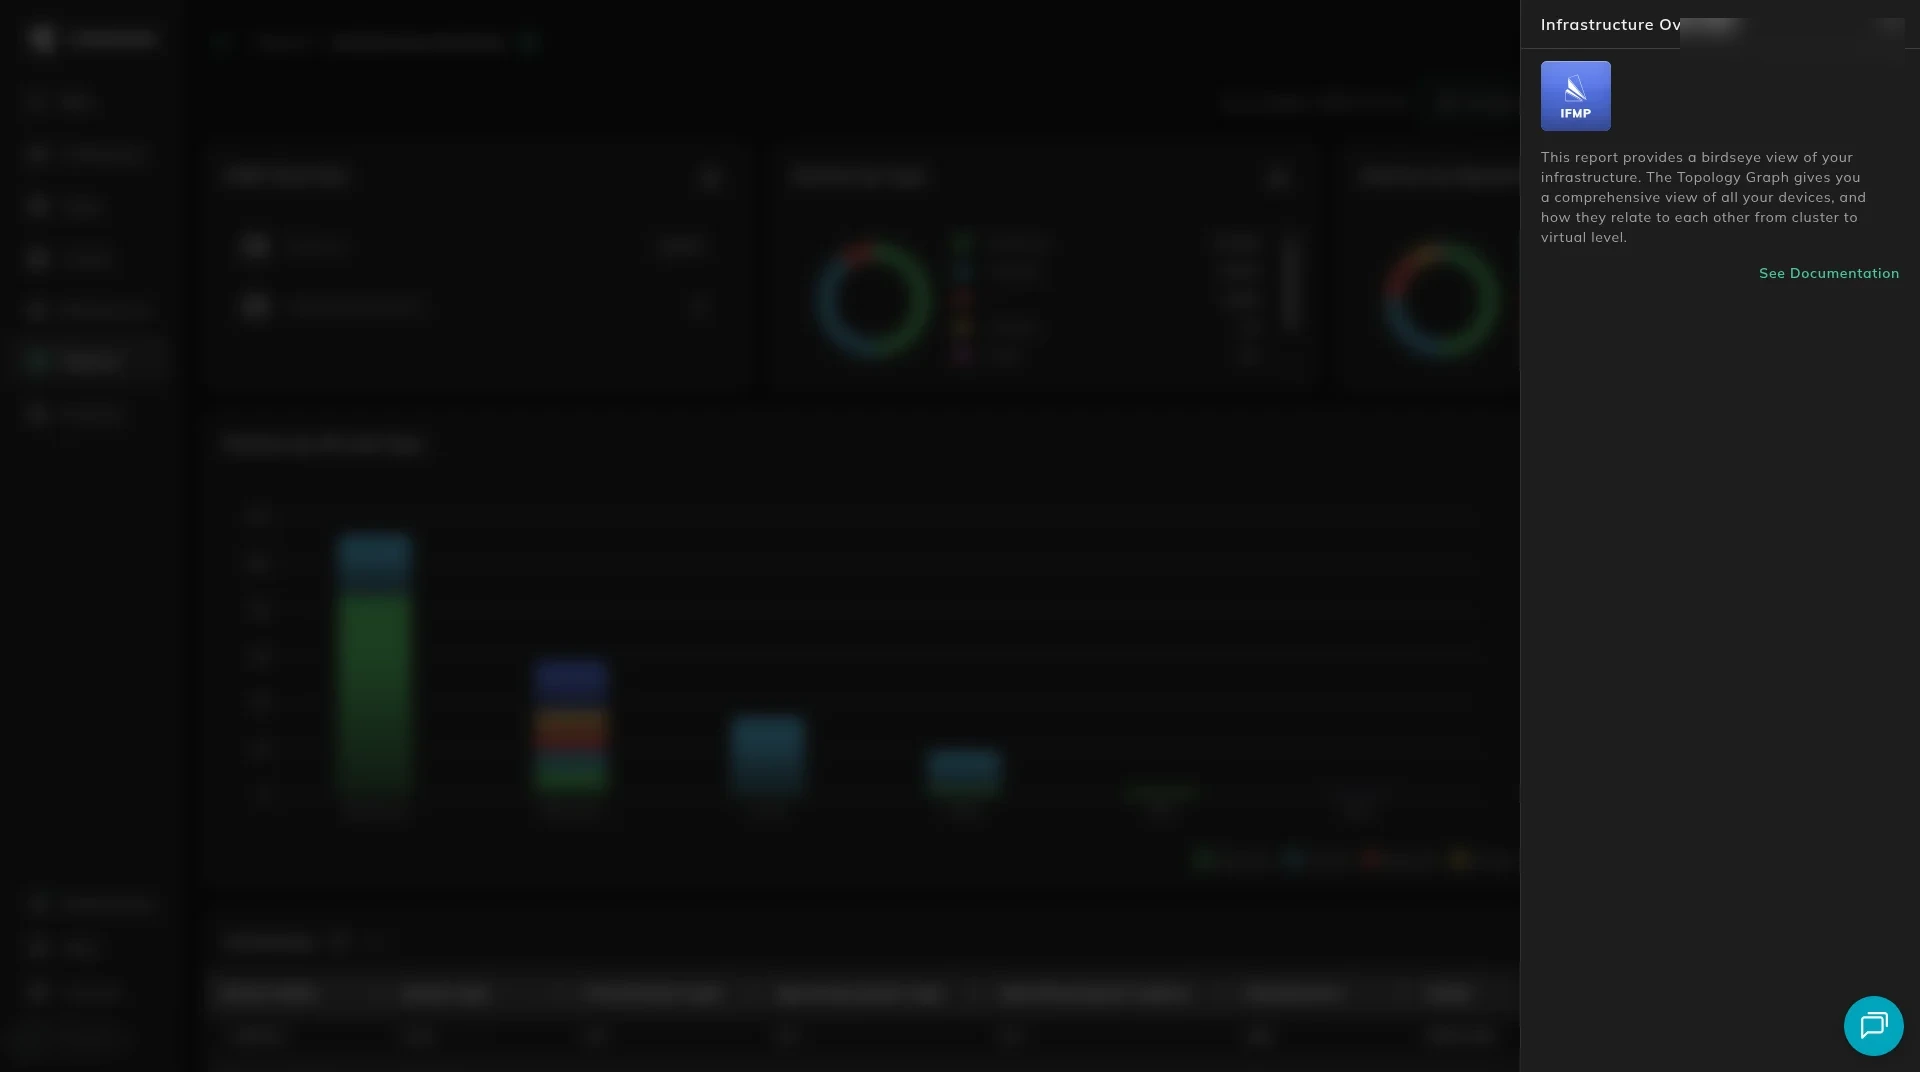
The controls on a report are the same on every report. Download saves the report. Compare, with Live (read only), is where a snapshot is saved and compared.
Some reports use data from multiple apps
Section titled “Some reports use data from multiple apps”Many reports are powered by a single app’s data, such as Microsoft SQL Server Details (from MDM). However, some reports need data from more than one app.
Example: Oracle Database Consolidated report
Section titled “Example: Oracle Database Consolidated report”To generate this report, data must be processed from:
- ODBM (Oracle Database Manager), which provides detailed usage and database option data.
- IFMP (Infrastructure Mapper), which supplies the infrastructure and CPU topology.
Combining both sources gives a complete and accurate Oracle licensing calculation, because it takes both software usage and the underlying hardware or virtual infrastructure into account.
The panel shows the icon of each app whose data the report needs, so you can check its data dependencies before uploading or viewing.
Report tools
Section titled “Report tools”These controls work the same way on every report.
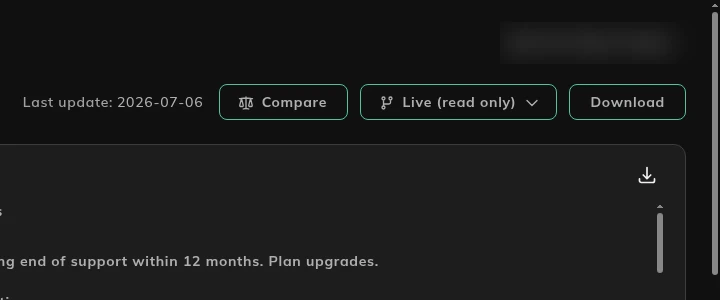
| Control | What it does |
|---|---|
| Last update | When the report last refreshed. |
| Compare | Puts this report next to a snapshot, or next to another project. |
| Live (read only) | The current data. Open it to pick a saved snapshot. |
| Download | Saves the report. A large download runs in the background. An Excel export over 500,000 rows is saved as CSV. |
Open a snapshot
Section titled “Open a snapshot”Open Live (read only). The menu lists Live (read only), then saved snapshots such as v1 with a date, and Create snapshot.
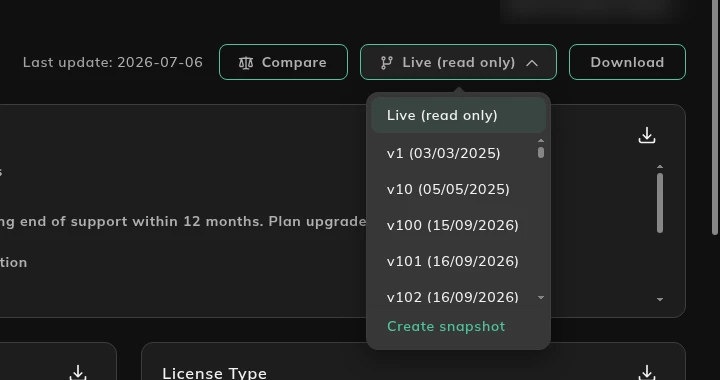
Live (read only) is the data as it is now. A snapshot is a copy of the report you can come back to. Create snapshot saves the live report as a new snapshot on this menu.
Compare
Section titled “Compare”Click Compare. The heading becomes Compare, your project stays on the left of VS, and Select… on the right is where you choose what to put next to it.
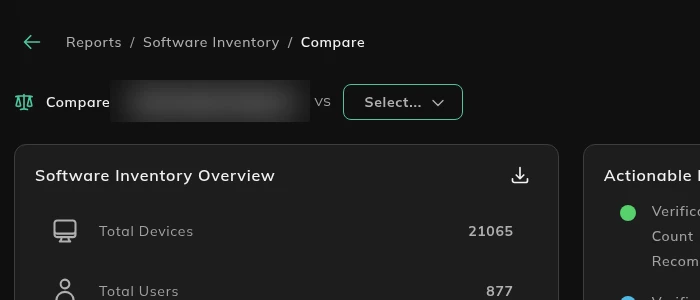
Open Select…. Snapshots lists saved copies of this report. Projects lists your other projects.
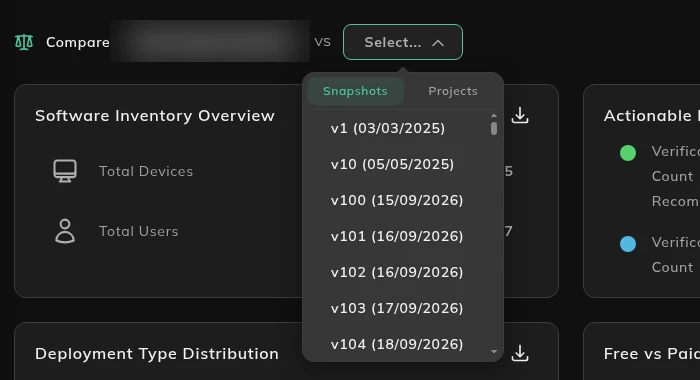
Every tile then shows both versions side by side, in the colors named in its legend. The Overview shows each count in its own column, and charts show a bar for each version. To compare two snapshots with each other, pick a snapshot from the left-hand menu as well.
Tables and charts
Section titled “Tables and charts”On a chart, the download icon saves that chart.
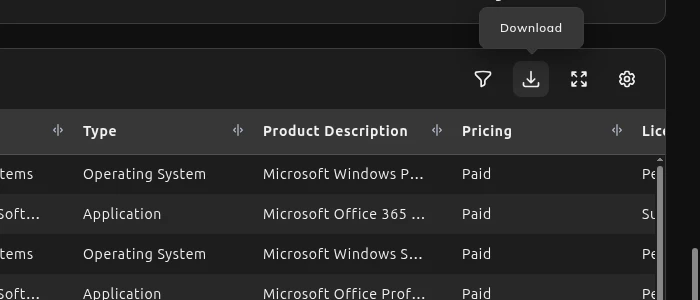
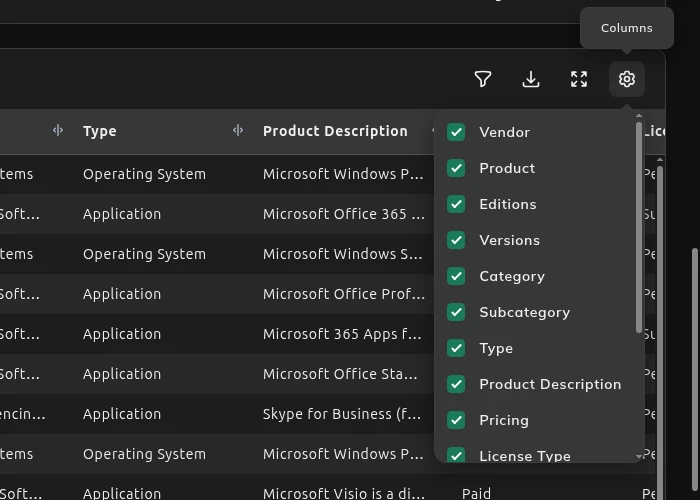
On a table, four icons sit at the top right, in this order.
The funnel’s tooltip reads Activate column filters. It puts a box under each column heading. With the boxes showing, the same icon reads Hide column filters.
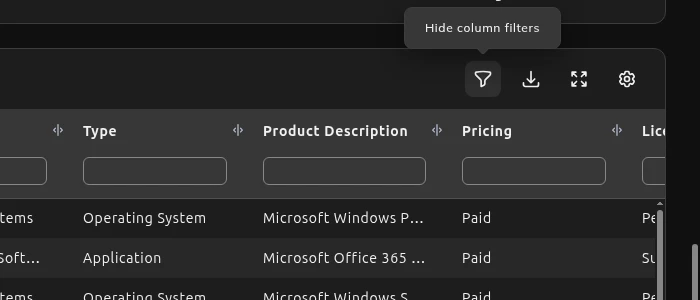
Download saves that table.
Aggregated tables
Section titled “Aggregated tables”A table of totals, such as installs, devices or users per software, is the summary on the report. Download on that table saves the rows behind the totals: one row per device, with the user.
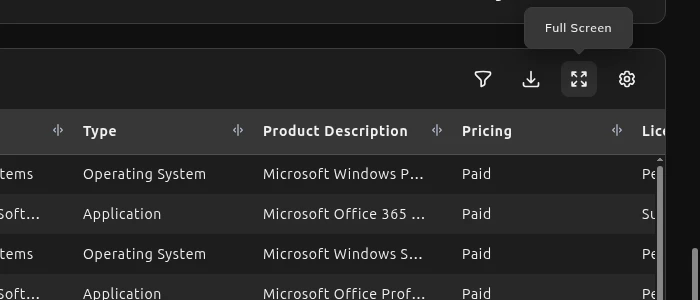
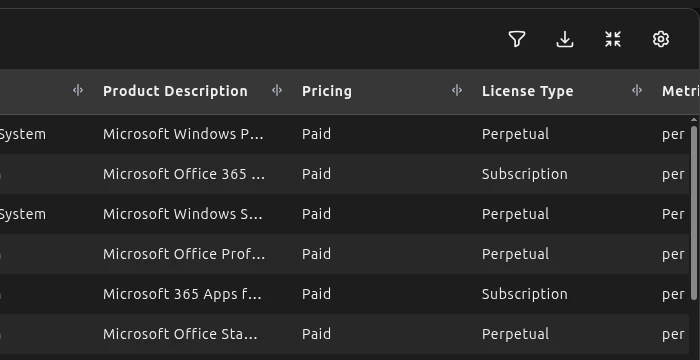
Full Screen opens the table on its own. The same four icons stay with it.
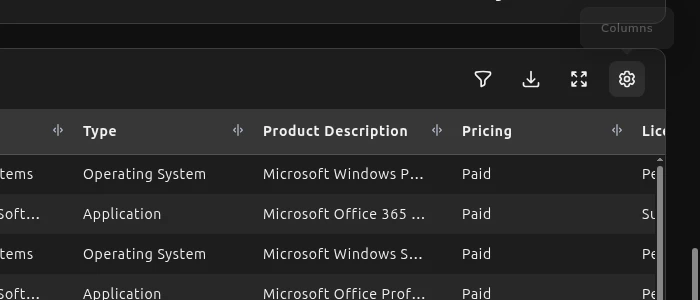
Columns opens a checklist of that table’s columns. A tick means the column is showing.
Rows per page, under the table, sets how many rows you see.
Frequently asked questions
Section titled “Frequently asked questions”Report not available? Check that all the required data has been uploaded and successfully processed. A report only appears once all the inputs it needs from the relevant apps are available. Large imports can take up to 24 hours to process.
Unexpected reports showing up? Some apps and datasets contribute to several reports. For example, uploading RVTools data (through IFMP) may generate Microsoft or Red Hat reports if it contains evidence of Windows Server or RHEL installations. This is expected.
Why is a table cut off? On the free plan, a report table shows up to 10 rows. The full table is on a paid plan. Rates are on licenseware.io/plans.
Need a report that doesn’t exist? Create a Custom Report from the Custom tab, or ask Licenseware support for it.