

Software Licenses & Contracts
Software Licenses & Contracts is the portfolio, not the calendar. Use it when finance asks what the estate costs, or when you need the vendors and license types behind that number. What renews in the next year is Renewals & Lifecycle.
LCM has two project-level reports. Both run on the contract and license data in the current project, and both use the same data quality engine to surface action items.
| Software Licenses & Contracts | Renewals & Lifecycle | |
|---|---|---|
| Lens | What do we have, and what is it costing us | What is coming up, and what is at risk |
| Audience | License managers, finance, executives | Procurement, renewal managers |
| Time view | A snapshot of the current state | Forward-looking, on the renewal calendar |
| Spend view | Total spend by vendor, type or another cut | Renewal spend by month, type and vendor |
| Action items | Yes, shared with the other report | Yes, the same shared list |
Open it from Apps, then License and Contracts Manager, on the Reports tab.
At a glance
Section titled “At a glance”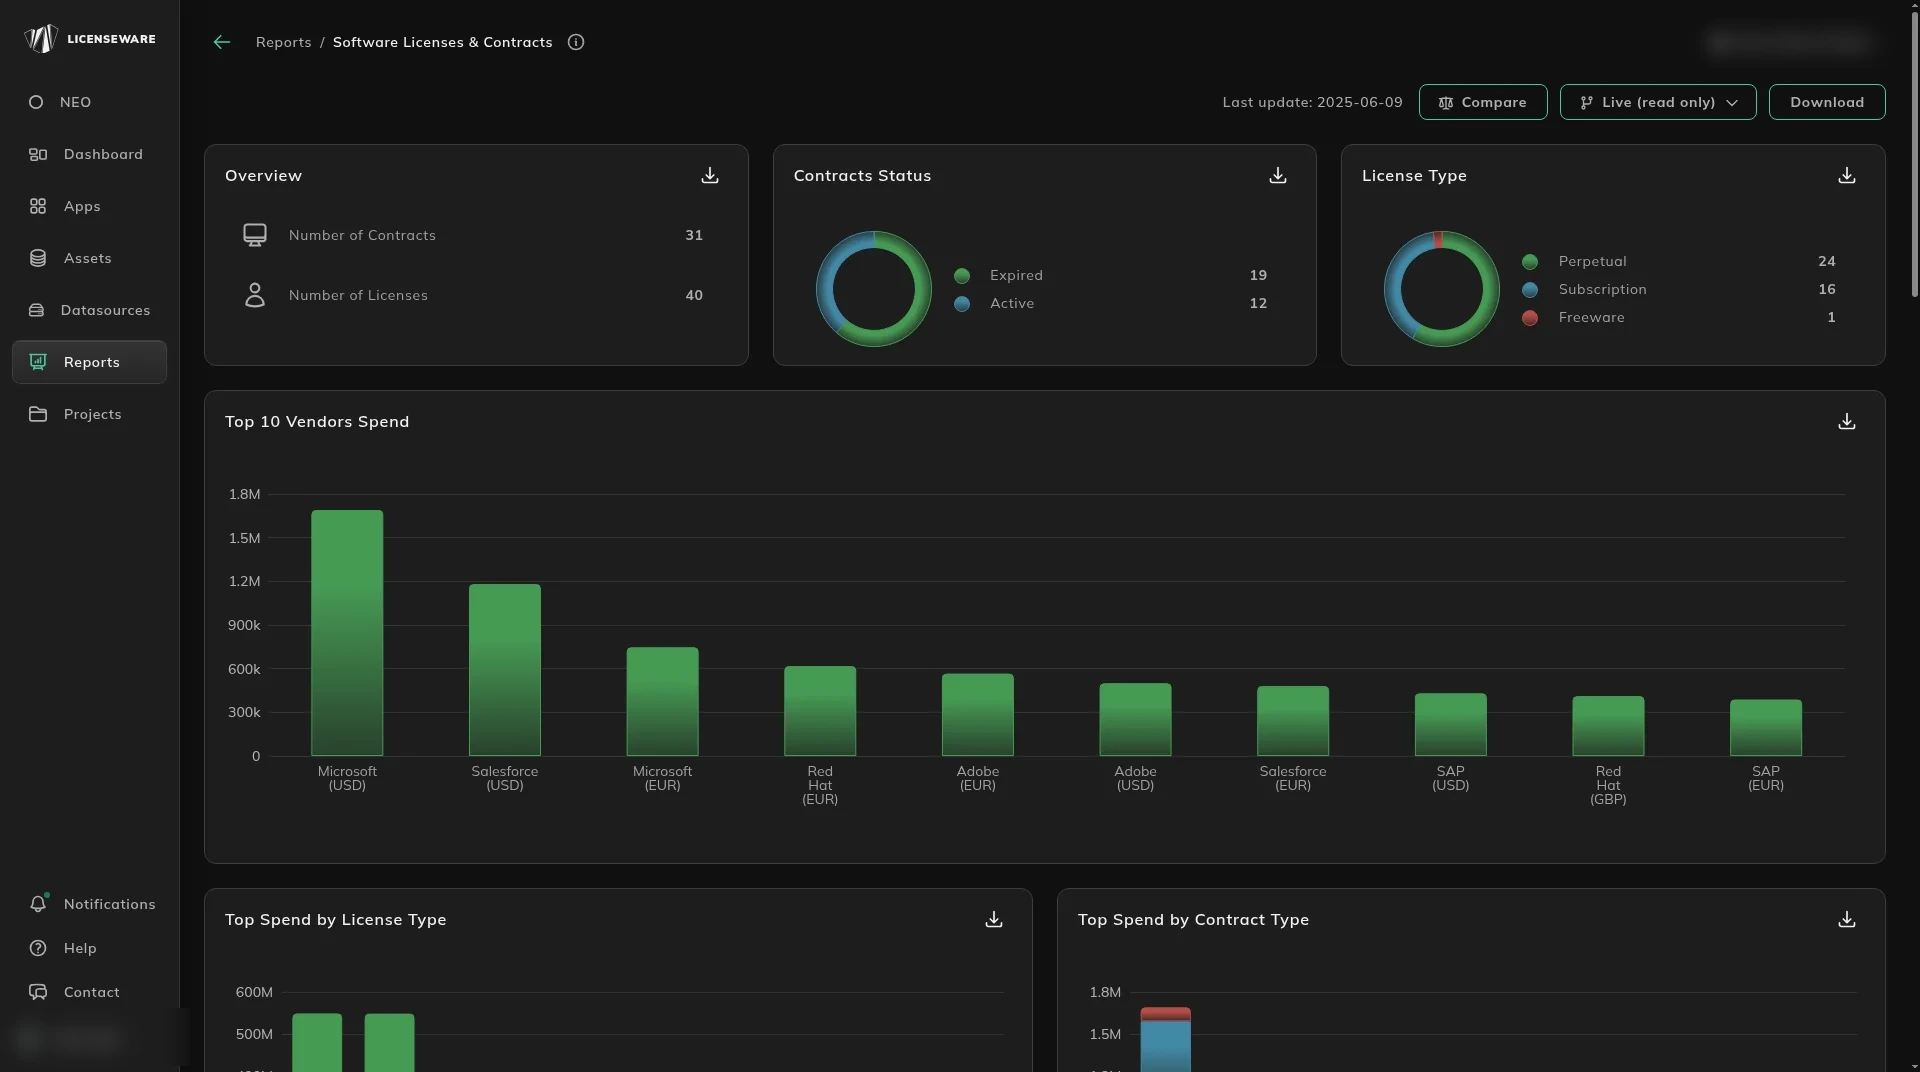
The charts are a scan of the book of record.
- Overview is the size of that book: Number of Contracts and Number of Licenses.
- Contracts Status splits the book, for example Expired and Active.
- License Type splits licenses, for example Perpetual, Subscription and Freeware. A freeware row is not a contract you can renegotiate.
- Top 10 Vendors Spend is total spend per vendor, ranked. It reads
total_valueon the contract. - Top Spend by License Type splits that spend, per vendor, across Perpetual, Subscription and Freeware. That is the commercial model mix for the vendor.
- Top Spend by Contract Type splits per-vendor spend across the contract type categories. Where the types are diverse, the chart can run to more than one page.
- Top Spend by Business Unit and Top Spend by Cost Center are the same spend, cut by those fields. Each spend chart is split by currency.
What you are actually paying for
Section titled “What you are actually paying for”Licenses and Contracts are the rows behind those charts. Both tables include the standard schema columns plus any Settings template columns. A total with no rows you trust is not a number you can take to finance.
Data Completeness lists contracts that are missing a value. The same table is on Renewals & Lifecycle. It is the same data, from a shared engine, so the recommendations do not change with the report. Actions include Add Financial Value, Add Business Unit, Add Renewal Notice, Add Cost Center, Add Department and Add Business Owner.
| Column | What it shows |
|---|---|
| Affected Contracts | How many contracts have that field empty. |
| Total Contracts | The project total, for context. |
| Coverage (%) | The share of contracts where the field is filled. Higher is better. |
| Severity | How much that gap blocks what LCM can do. See the scoring below. |
How severity is scored
Section titled “How severity is scored”Severity is how important the field is to the value LCM can deliver.
- High. The field blocks the platform from working as intended.
total_valueis the case that matters most. Without a financial value, the spend charts and the value-at-risk figures are incomplete. - Medium. The field blocks a specific cut or a downstream step.
renewal_notice_daysblocks reminders. Business Unit and Cost Center block the organizational breakdowns. - Low. The field is useful, and it does not block a core function.
business_ownerand Department sit here.
Severity is portfolio-wide, not per contract. A High row means the field is missing on many or all contracts. It is not a priority flag on one contract. For that, use Actionable Insights.
Actionable Insights is the other half of that. Data Completeness says which kinds of issue the portfolio has. Actionable Insights says which contracts need the work. Each row is one contract: contract number, name, vendor, the actions still open (Add Financial Value, Add Renewal Notice, and the rest), the action count, severity, total value, currency, end date and business unit. Severity on the row is the highest severity across that contract’s actions. The table is sorted by severity and end date. Use it as the weekly worklist.
A missing value drops that agreement out of the spend charts, so the total is short of the real estate.
Use the two reports together
Section titled “Use the two reports together”- Monthly portfolio review. Open this report. Check the overall numbers, see which vendors are moving up the spend ranking, and work the Actionable Insights table.
- Weekly renewal triage. Open Renewals & Lifecycle. Review Upcoming Renewals, take the 30-day bucket first, and check the spend-by-month chart for a cliff.
- Quarterly data quality push. Use Data Completeness on either report to drive a pass of enrichment. High severity first.
- Monthly trend. Save a snapshot each month and compare it with the live report, so a board pack can show what changed and not only the current state. See Using reports.
Whether a license covers what is installed is not on this report. It is the allocation strip on a license: ENTITLED, DEPLOYED, TRACKED and CUSTOM RESERVED.
Download on an aggregated table saves one row per device, with the user. See Using reports.